A Confidential Information Memorandum (CIM) is a critical document in the business sale process, designed to attract potential buyers by providing an in-depth overview of a company and its market. The market analysis section is one of the most important parts, helping buyers assess the company’s position, opportunities, and risks.
Here’s what to include:
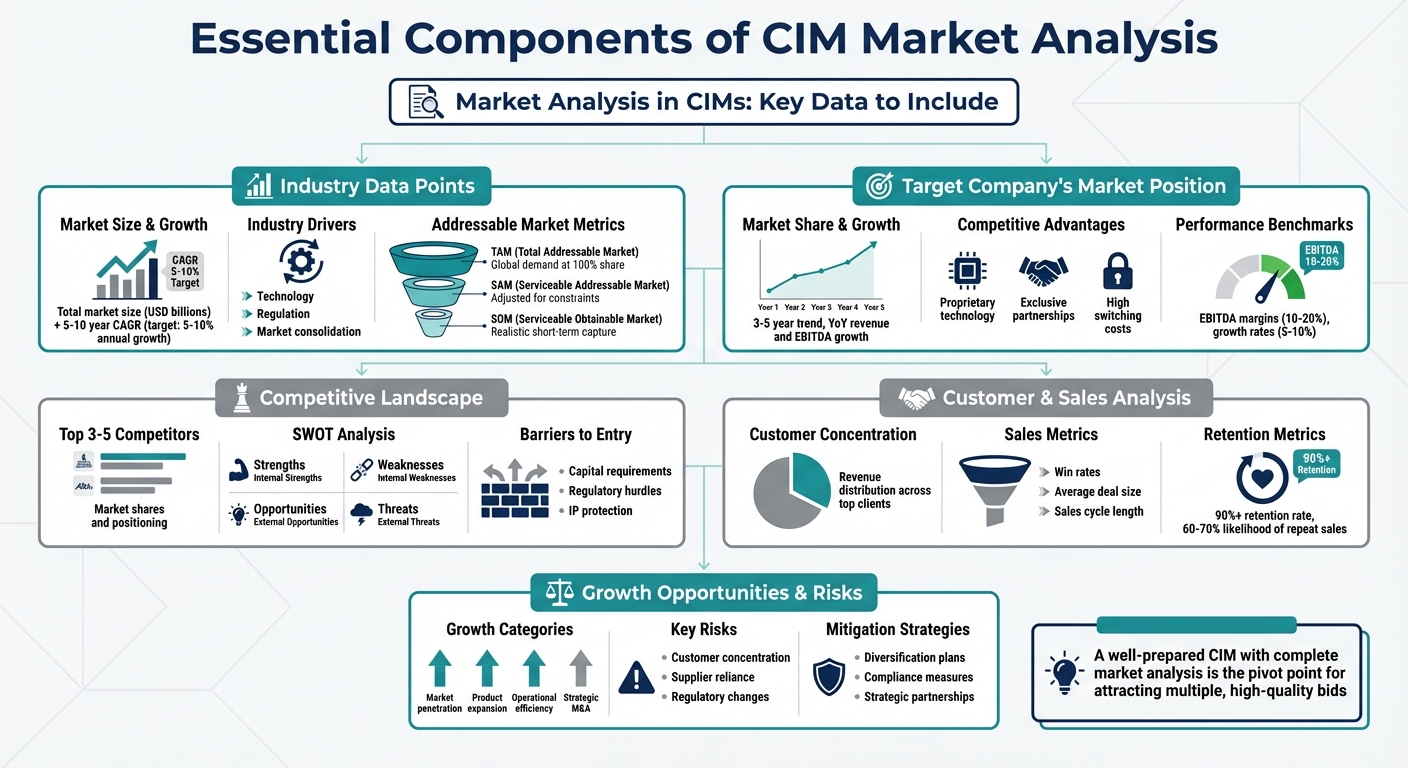
- Market Size & Growth: Show the total market size, growth rate (CAGR), and trends driving the industry. Use reliable sources like Gartner or Bloomberg to back up your data.
- Key Industry Drivers: Explain what’s fueling growth, such as technology, regulation, or market consolidation. Address risks and provide mitigation strategies.
- TAM, SAM, SOM: Break down the Total Addressable Market, Serviceable Addressable Market, and Serviceable Obtainable Market to clarify potential opportunities.
- Competitive Position: Highlight the company’s market share, growth, and competitive advantages like proprietary technology or customer loyalty. Use benchmarks to compare performance with competitors.
- Customer & Sales Insights: Detail customer concentration, retention rates, and revenue sources. Include metrics like sales growth, win rates, and pricing power.
- Growth Potential & Risks: Outline specific growth strategies (e.g., new markets, product expansion) and address risks like customer reliance or regulatory changes. Provide realistic solutions.
Key takeaway: A strong market analysis gives buyers the data they need to understand the company’s value and potential, while addressing risks transparently.
Essential Components of CIM Market Analysis
Industry Data Points to Include
A thorough industry analysis lays the foundation for evaluating a target company’s position in its market. By examining industry data, you can understand the market’s size and trajectory, which is essential for assessing how well the target company is positioned to compete.
Market Size and Growth Projections
Start by outlining the market size, typically expressed in USD billions, and pair it with a 5-10 year Compound Annual Growth Rate (CAGR) to highlight the market’s growth momentum. Ideally, target industries should exhibit an average annual growth rate of 5-10%. Use credible sources like Gartner, IDC, Forrester, Bloomberg, or Reuters to back up these projections. Avoid overly optimistic "hockey stick" growth projections that lack a solid historical basis – savvy buyers will quickly notice any unrealistic assumptions.
"It is imperative for the acquirer to know the market size and current market trends." – Tim Vipond, FMVA, Corporate Finance Institute
This data not only establishes a quantitative baseline but also sets the stage for analyzing the trends driving market growth.
Industry Drivers and Trends
Identify the key drivers fueling market growth and connect them to the target company’s role within the industry. For example, are technological innovations creating new demand, or are regulatory changes opening up fresh opportunities? Many sectors are also experiencing consolidation, with larger companies acquiring smaller ones to build "roll-up" platforms. Provide concrete evidence that ties these trends to the target company’s market position.
Additionally, address potential challenges by including a brief "Risks & Mitigations" section. This could cover issues like regulatory shifts or supply chain vulnerabilities, showing that you’ve considered hurdles and how they might be managed.
Addressable Market Metrics
Once you’ve covered market size and trends, narrow the focus to actionable market segments. Highlight three key metrics:
- Total Addressable Market (TAM): The total global demand, assuming 100% market share.
- Serviceable Addressable Market (SAM): A subset of the TAM, adjusted for geographic, regulatory, or technical constraints.
- Serviceable Obtainable Market (SOM): The portion of the SAM that the company can realistically capture in the short term.
This progression from TAM to SOM not only illustrates the market’s overall potential but also clarifies where realistic growth opportunities exist. It helps buyers visualize how and where the company can expand.
sbb-itb-798d089
Target Company’s Market Position
Once you’ve outlined the broader industry landscape, it’s time to zero in on how the target company stacks up within that space. Buyers aren’t just looking for a business in a growing market; they want proof that the company is actively gaining ground and outperforming its competitors.
Market Share and Growth
Start by showcasing the company’s current market share and how it’s trended over the past 3–5 years. Include year-over-year growth in revenue and EBITDA to paint a clear picture. For instance, holding 15% market share in a fragmented market tells a very different story than the same share in a consolidated one. Comparing these numbers to industry averages helps highlight whether the company is advancing or falling behind.
"I find the most important thing to identify is competitive differentiation – essentially what will enable this business to continue growing and win market share from competitors." – CompBanker, Private Equity Vice President
Consider an example where a company achieved 8% revenue growth while maintaining stable EBITDA, even as fuel costs increased. This demonstrates how even modest market share gains can add value. Projections should also align with industry trends – if the company forecasts 25% annual growth in an industry growing at just 7%, you’ll need to explain the specific strategy behind that leap. A strong market position lays the groundwork for understanding the company’s unique competitive strengths.
Competitive Advantages
Next, detail the company’s sustainable competitive advantages. These might include proprietary technology, exclusive partnerships, high switching costs, or strong brand loyalty. Avoid generic claims like "great customer service." Instead, back up statements with data – such as customer satisfaction scores (e.g., 4.8/5.0 compared to an industry average of 4.2/5.0) or retention rates. If the company has earned industry awards or "best in class" recognitions, include them to build credibility.
It’s also important to determine whether growth has been organic or acquisition-driven. Buyers want to uncover the company’s "secret sauce" – whether it excels on price, service quality, technical expertise, or another key factor. Beyond identifying these strengths, compare the company’s performance to its competitors to assess how sustainable its position truly is.
Performance Benchmarking
Benchmarking is a critical step. Compare the company’s performance to industry peers using metrics like revenue growth, EBITDA margins, and free cash flow conversion. Use Adjusted EBITDA to account for one-time expenses, ensuring a fair comparison. Generally, EBITDA margins between 10–20% and annual growth rates of 5–10% signal solid performance.
Be upfront about any potential weaknesses. For example, if the company relies heavily on a small number of customers (e.g., the top three clients account for 60% of revenue), outline a clear plan to mitigate that risk or highlight recent diversification efforts. Buyers value transparency when paired with a credible solution. Providing employee profiles by function and customer profiles showing revenue contributions from the top 5–10 clients can also help buyers evaluate operational efficiency and risk.
Competitive Landscape Overview
Once the target company’s market position is established, buyers need a clear snapshot of the competition and the forces shaping the market. This section highlights key competitors and the factors that either bolster or challenge the company’s standing. It builds on the earlier discussion of the target’s position in the market.
Top Competitors and Market Shares
Identify 3–5 key competitors, outlining their approximate market shares and providing a brief analysis of their strengths and weaknesses. Focus on competitors that directly influence the target company’s specific business areas and geographical markets. For example, one competitor might generate tens of millions in revenue with notable EBITDA margins.
Include the target company’s ranking within its industry, such as being the third-largest player in a regional market or a top-five contender nationally. This context helps buyers quickly grasp the target’s position. Highlight the "economic moat" – the unique factors that make customers choose the target company over its competitors. These could include proprietary technology, exceptional service quality, or long-term contracts that create high switching costs.
SWOT Analysis Comparison
Break down the target company’s Strengths, Weaknesses, Opportunities, and Threats (SWOT) with data-backed insights.
- Strengths: Emphasize competitive advantages like exclusive technology or strong relationships with blue-chip clients.
- Weaknesses: If challenges exist, offer tangible mitigation strategies. For example, if 40% of revenue comes from a concentrated customer base, note any diversification efforts underway.
- Opportunities: Highlight untapped areas such as new markets or operational improvements a buyer could implement.
- Threats: Identify industry challenges but explain how the target company is uniquely equipped to handle them.
"I was really impressed with how [the advisor] helped us… They discovered strengths about my customer retention that I wasn’t even fully aware of, and they knew how to put the story together the right way." – John Hinckley, CEO, Modern Message
To deepen the analysis, consider presenting a comparison table to evaluate the target company alongside its top competitors across critical factors:
| Factor | Target Company | Competitor A | Competitor B |
|---|---|---|---|
| Strengths | Proprietary technology, 95% retention rate | Larger scale, national footprint | Lower pricing, aggressive sales |
| Weaknesses | Limited geographic reach | Legacy systems, lower margins | High employee turnover |
| Opportunities | Geographic expansion, cross-selling | Digital transformation | Market consolidation |
| Threats | New regulatory requirements | Price competition | Disruptive technology |
Barriers to Entry and Disruptive Threats
This section examines external factors that protect or threaten the company’s position in the market.
Barriers that secure the company’s position often include high capital requirements, regulatory hurdles, specialized expertise, or proprietary intellectual property. For instance, industries with steep upfront investment costs or complex compliance requirements naturally deter new competitors. Other protective factors include network effects and high switching costs.
Disruptive threats, such as industry consolidation, pricing pressures, or emerging technologies, should also be addressed. Highlight potential risks like reliance on single-source suppliers or regulatory changes, but pair these with credible mitigation strategies. Buyers value transparency when it’s coupled with realistic plans.
"It is a marketing document intended to make a company look as shiny as possible… but it’s up to you to go beneath the dress and see what it looks like without the makeup." – Brian DeChesare, Founder, Mergers & Inquisitions
Customer and Sales Analysis
Once you’ve established the company’s position in the market and among competitors, the next step is to dive into its revenue streams. Understanding where a company’s revenue comes from – and how stable those sources are – provides a clearer picture of its ability to maintain or grow its market share. This section focuses on the customer base, sales performance, and retention metrics, all of which offer valuable insights into the company’s long-term potential.
Customer Base Overview
Start by examining customer concentration – how much of the company’s revenue comes from its largest clients. If a significant portion of revenue relies on just a few customers, it could pose a risk for potential buyers. To balance this, highlight the geographic spread and industry diversity of the customer base. This mix can offset risks tied to over-reliance on a small group of clients.
For B2B companies, describe the typical customer profile to showcase the company’s market focus. Meanwhile, for B2C businesses, consider customer behavior: Are purchases high-involvement decisions requiring research, or are they habitual and driven by brand loyalty? These patterns reveal the depth and nature of customer relationships, helping buyers gauge the company’s ability to retain and grow its audience.
Sales Metrics and Pipeline
A healthy, predictable sales engine is a priority for buyers. Many mid-market companies grow at a steady rate of 5-10% annually. It’s important to distinguish between growth that comes organically – through increased sales and market traction – and growth fueled by acquisitions, as organic growth often signals stronger market demand.
To paint a clear picture of sales performance, include key pipeline metrics like win rates, average deal size, and sales cycle length. Identify the primary marketing and sales channels – whether that’s direct sales, digital campaigns, partnerships, or referrals – that bring in revenue. Pricing power is another important indicator: Can the company increase prices by 3-4% annually without losing customers? If so, this reflects strong market positioning and customer loyalty.
"There are only small risks associated with the company – a diversified customer base, high recurring revenue, long-term contracts, and so on, all demonstrate this point." – Brian DeChesare, Founder, Mergers & Inquisitions
Retention and Revenue Metrics
Customer retention is one of the most telling signs of a company’s health. A retention rate of 90% or higher suggests strong loyalty and creates a formidable competitive advantage. Consider this: The likelihood of selling to an existing customer is 60-70%, compared to just 5-20% for a new customer. This stark difference highlights why retention plays such a critical role in revenue stability.
Alongside retention rates, present churn data and average revenue per user (ARPU) to show the value each customer brings. If the company has dropped unprofitable clients to boost margins, frame this as a strategic decision that improves overall financial health.
Finally, clarify the nature of the company’s revenue streams. Is revenue secured through long-term contracts with automatic renewals, or does it rely on recurring bids in a competitive market? Revenue tied to long-term agreements is generally more dependable and valuable than month-to-month arrangements, so it’s important to outline which model the company primarily uses.
Growth Opportunities and Risks
After reviewing the company’s sales performance and customer relationships, it’s time to dive into the investment thesis. This section focuses on positioning the business as a platform for future growth while being upfront about any potential hurdles.
Growth Potential and Expansion Plans
Buyers are looking for clear, actionable paths to grow revenue – not just broad ideas. For example, instead of vaguely mentioning "expanding into new markets", detail how hiring a two-person sales team could open up a $50 million opportunity in an untapped healthcare vertical or adjacent market. Specifics like these turn abstract potential into a believable growth roadmap.
Operational enhancements can also drive significant gains. Highlight areas where automation, supply chain improvements, or cost-cutting could increase EBITDA margins without requiring heavy investments. If the current owner has underinvested in areas like digital marketing or tech infrastructure, present these as quick wins for a buyer to drive revenue growth efficiently. Another practical opportunity? Cross-selling to existing blue-chip clients. Strong relationships with major accounts that haven’t been fully leveraged can lead to predictable revenue growth with minimal customer acquisition costs. Additionally, a solid order backlog or multi-year contracts provide visibility into future income, which is especially appealing to financial buyers.
Inorganic growth through acquisitions is another compelling angle. In fragmented markets, rolling up smaller regional competitors can quickly expand market share while taking advantage of the company’s existing infrastructure and relationships.
| Growth Category | Specific Examples to Include | Buyer Value Proposition |
|---|---|---|
| Market Penetration | Expanding into untapped regions or segments | Expands Total Addressable Market (TAM) |
| Product Expansion | Adding new product lines or services | Increases customer spend via cross-selling |
| Operational Efficiency | Automating processes; optimizing supply chain | Boosts EBITDA margins and free cash flow (FCF) |
| Strategic M&A | Identifying smaller acquisition targets | Drives growth through consolidation |
These opportunities naturally lead to the next topic: addressing the risks that come with growth.
Key Risks and Challenges
While growth strategies are exciting, they also come with challenges. Buyers will want transparency about potential risks, as they’ll uncover them during due diligence anyway. Addressing these upfront – with clear mitigation plans – helps build trust and prevents negative assumptions.
Common risks include customer concentration, where a few clients generate a disproportionate share of revenue, reliance on single-source suppliers, or an overdependence on the owner for key operations. For each issue, outline a practical mitigation plan. For example, diversifying customer contracts can reduce concentration risk, empowering a strong middle-management team can offset owner reliance, and leveraging specialized expertise can help navigate pricing pressures.
"A well-prepared CIM – one that is professional, transparent, and compelling – is the pivot point for attracting multiple, high-quality bids." – Sunbelt Atlanta
Financial constraints like high capital expenditures or significant working capital needs can also be a concern, as they limit free cash flow for reinvestment or debt repayment. However, it’s important to explain how these constraints are tied to planned growth initiatives rather than operational inefficiencies. Additionally, address risks like regulatory changes, pending litigation, or compliance issues, and share the steps already taken to mitigate these challenges.
Finally, ensure that any future projections are grounded in historical performance and realistic market conditions. Back these forecasts with tangible catalysts, such as signed contracts or clear market trends. Tailor the narrative to the buyer’s perspective, highlighting either strategic synergies or financial returns, depending on their priorities.
How Deal Memo Delivers Complete Market Analysis
Creating a CIM market analysis can be a tedious task, pulling professionals away from more strategic deal-making activities. That’s where Deal Memo steps in, offering an on-demand CIM writing service that delivers a polished, professional draft in just 72 hours.
The process kicks off with structured seller interviews designed to uncover the company’s unique selling points – whether it’s competitive pricing, superior service quality, or niche specialization. These interviews also help shape the investment thesis by revealing market entry opportunities and growth potential that might not be immediately obvious from the financials. The result? A well-crafted narrative that highlights the company’s market strengths, such as proprietary technology, exclusive partnerships, or access to untapped customer segments. This narrative is then paired with a tailored presentation to make the case even stronger.
Deal Memo goes a step further by ensuring that the final CIM aligns seamlessly with your firm’s branding and standards through its white-labeled packages. With unlimited calls, meetings, and revisions, the service guarantees that the market analysis fully captures the opportunity at hand. By handing off the time-consuming tasks of research and data entry, M&A teams can focus their energy on sourcing deals and building relationships with buyers.
Beyond showcasing advantages, Deal Memo also tackles potential risks head-on. Seller interviews encourage open discussions about challenges, such as competitive threats or market hurdles. Instead of skimming over these issues, Deal Memo collaborates with your team to address them transparently. This honest approach not only fosters trust with savvy buyers – who are likely to dig into these details during due diligence – but also results in a balanced, credible market analysis that can withstand scrutiny.
Conclusion
A solid market analysis is the backbone of any effective CIM. It not only supports the investment thesis but also justifies valuation and creates the competitive energy needed to draw in serious buyers. Without reliable market data – covering everything from industry growth patterns to competitive positioning – your CIM could be dismissed by potential acquirers before they even take a look at the financials. As Tammie Miller, Managing Director at TKO Miller, aptly states: "A poorly constructed CIM will do the exact opposite [of controlling the story], and there is zero room for error".
This highlights the importance of professional execution. That’s where Deal Memo comes in. They simplify this intricate process by delivering a custom, up-to-date CIM within 72 hours, complete with unlimited revisions to adapt to changing deal conditions. The result? A document that reflects your firm’s branding and provides the market insights buyers expect.
FAQs
What essential market analysis data should be included in a CIM?
A well-rounded market analysis in a Confidential Information Memorandum (CIM) should spotlight key industry trends, competitive positioning, and growth opportunities. Dive into the details of market size, growth rates, and emerging trends that directly influence the business and its future prospects.
To add depth, include a SWOT analysis – breaking down the company’s strengths, weaknesses, opportunities, and threats. Pair this with an overview of the competitive landscape, highlighting what sets the business apart from its competitors. By presenting this information clearly, potential buyers can better understand the market dynamics and how the company fits within them.
How can a business effectively highlight its competitive strengths in a CIM?
To effectively showcase competitive strengths in a CIM, focus on crafting a clear, data-backed narrative that highlights what sets the business apart in its market. Start with a concise SWOT analysis that underscores key strengths like proprietary technology, strong customer loyalty, or high-margin contracts. Connect these strengths to measurable outcomes – such as revenue growth, market share, or cost savings. For instance, citing a 3-year CAGR of 12% compared to an industry average of 6% not only builds credibility but also paints a compelling picture of performance.
Use comparative data to position the company favorably against competitors. Tables or charts can effectively illustrate superior financial ratios, customer retention rates, or geographic reach. Dive into the reasons behind these advantages – whether it’s patented processes, exclusive agreements, or scalable platforms – and quantify their impact. For example, you might highlight how "a patented process reduces production costs by $0.45 per unit, increasing gross margins by 4 percentage points."
Finally, link these competitive strengths to the company’s financial projections and growth strategy. Show how they fuel expected revenue and EBITDA growth, and outline specific initiatives like new product launches or market expansions that will further strengthen the company’s position. For a polished and cohesive presentation, professional services like Deal Memo can ensure the CIM is formatted and presented with precision and consistency.
How can potential risks be effectively addressed in the market analysis section of a CIM?
To tackle potential risks in the market analysis section of a CIM, begin by sourcing reliable, up-to-date data. This includes insights on industry trends, competitor performance, and key growth factors. Double-check every piece of information to ensure accuracy, as this not only strengthens your analysis but also builds trust with potential buyers.
A SWOT analysis is a valuable tool for identifying risks like uncertain market sizes, regulatory shifts, or supply chain issues. Combine this with scenario analysis to show how variables such as price elasticity or demand growth could influence financial outcomes. This approach helps buyers see both the challenges and the strategies to address them.
Structure your analysis thoughtfully. Start with broad macroeconomic trends, then dive into competitive positioning, and wrap up with a detailed look at quantified risks. Being transparent about risks demonstrates credibility and ensures the narrative remains cohesive. Lastly, safeguard sensitive information by using NDAs and secure platforms, giving buyers confidence that risks are genuine and well-managed.